
9:38 PM

Gabriella Brianna
, Posted in
NASA News
,
0 Comments
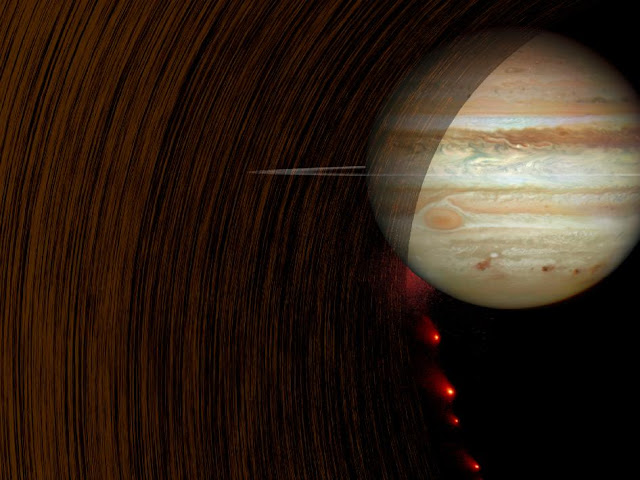
Like forensic scientists examining fingerprints at a cosmic crime scene, scientists working with data from NASA's Cassini, Galileo and New Horizons missions have traced telltale ripples in the rings of Saturn and Jupiter back to collisions with cometary fragments dating back more than 10 years ago.
The ripple-producing culprit, in the case of Jupiter, was comet Shoemaker-Levy 9, whose debris cloud hurtled through the thin Jupiter ring system during a kamikaze course into the planet in July 1994. Scientists attribute Saturn's ripples to a similar object – likely another cloud of comet debris -- plunging through the inner rings in the second half of 1983. The findings are detailed in a pair of papers published online today in the journal Science.
"What's cool is we're finding evidence that a planet's rings can be affected by specific, traceable events that happened in the last 30 years, rather than a hundred million years ago," said Matthew Hedman, a Cassini imaging team associate, lead author of one of the papers, and a research associate at Cornell University, Ithaca, N.Y. "The solar system is a much more dynamic place than we gave it credit for."
From Galileo's visit to Jupiter, scientists have known since the late 1990s about patchy patterns in the Jovian ring. But the Galileo images were a little fuzzy, and scientists didn't understand why such patterns would occur. The trail was cold until Cassini entered orbit around Saturn in 2004 and started sending back thousands of images. A 2007 paper by Hedman and colleagues first noted corrugations in Saturn's innermost ring, dubbed the D ring.
A group including Hedman and Mark Showalter, a Cassini co-investigator based at the SETI Institute in Mountain View, Calif., then realized that the grooves in the D ring appeared to wind together more tightly over time. Playing the process backward, Hedman then demonstrated the pattern originated when something tilted the D ring off its axis by about 100 meters (300 feet) in late 1983. The scientists found the influence of Saturn's gravity on the tilted area warped the ring into a tightening spiral.
Cassini imaging scientists got another clue when the sun shone directly along Saturn's equator and lit the rings edge-on in August 2009. The unique lighting conditions highlighted ripples not previously seen in another part of the ring system. Whatever happened in 1983 was not a small, localized event; it was big. The collision had tilted a region more than 19,000 kilometers (12,000 miles) wide, covering part of the D ring and the next outermost ring, called the C ring. Unfortunately spacecraft were not visiting Saturn at that time, and the planet was on the far side of the sun, hidden from telescopes on or orbiting Earth, so whatever happened in 1983 passed unnoticed by astronomers.
Hedman and Showalter, the lead author on the second paper, began to wonder whether the long-forgotten pattern in Jupiter's ring system might illuminate the mystery. Using Galileo images from 1996 and 2000, Showalter confirmed a similar winding spiral pattern. They applied the same math they had applied to Saturn – but now with Jupiter's gravitational influence factored in. Unwinding the spiral pinpointed the date when Jupiter's ring was tilted off its axis: between June and September 1994. Shoemaker-Levy plunged into the Jovian atmosphere during late July 1994. The estimated size of the nucleus was also consistent with the amount of material needed to disturb Jupiter's ring.
The Galileo images also revealed a second spiral, which was calculated to have originated in 1990. Images taken by New Horizons in 2007, when the spacecraft flew by Jupiter on its way to Pluto, showed two newer ripple patterns, in addition to the fading echo of the Shoemaker-Levy impact.
"We now know that collisions into the rings are very common – a few times per decade for Jupiter and a few times per century for Saturn," Showalter said. "Now scientists know that the rings record these impacts like grooves in a vinyl record, and we can play back their history later."
The ripples also give scientists clues to the size of the clouds of cometary debris that hit the rings. In each of these cases, the nuclei of the comets – before they likely broke apart – were a few kilometers wide.
"Finding these fingerprints still in the rings is amazing and helps us better understand impact processes in our solar system," said Linda Spilker, Cassini project scientist, based at NASA's Jet Propulsion Laboratory, Pasadena, Calif. "Cassini's long sojourn around Saturn has helped us tease out subtle clues that tell us about the history of our origins."
The Cassini-Huygens mission is a cooperative project of NASA, the European Space Agency and the Italian Space Agency. JPL, a division of the California Institute of Technology in Pasadena, manages the Cassini-Huygens mission for NASA's Science Mission Directorate, Washington. The Cassini orbiter and its two onboard cameras were designed, developed and assembled at JPL. The imaging team is based at the Space Science Institute in Boulder, Colo. JPL managed the Galileo mission for NASA, and designed and built the Galileo orbiter. The New Horizons mission is led by Principal Investigator Alan Stern of Southwest Research Institute, Boulder, Colo., and managed by the Johns Hopkins Applied Physics Laboratory, Laurel, Md., for NASA's Science Mission Directorate.
For more information visit http://www.nasa.gov/mission_pages/cassini/whycassini/cassini20110331.html
useful links: Ferrini Boots, boy suits, Alligator boots
9:14 PM
Gabriella Brianna
, Posted in
NASA News
,
0 Comments

Students from three California schools – South High School, Torrance; West Covina High School, West Covina; and Diamond Bar High School, Diamond Bar, won the overall regional competition. Two other California schools also took top honors. Chaminade College Preparatory, West Hills, receied the coveted Regional Chairman's award, while Foshay Learning Center, Los Angeles, a team mentored by NASA's Jet Propulsion Laboratory in Pasadena, Calif., took home the Engineering Inspiration award.
The winners will represent the California region at the FIRST championships April 27 to 30 in St. Louis, where they will compete against 51,000 other students on more than 2,000 teams.
The FIRST program was founded two decades ago to encourage students to pursue careers in science and technology through robotics competitions. With the help of engineers from JPL, aerospace and other companies and institutions of higher education, FIRST continues to grow and inspire students.
For more information visit http://www.jpl.nasa.gov/news/news.cfm?release=2011-098
useful links: Ferrini Boots, boy suits, Alligator boots
9:09 PM
Gabriella Brianna
, Posted in
NASA News
,
0 Comments

NASA's Stardust spacecraft sent its last transmission to Earth at 4:33 p.m. PDT (7:33 p.m. EDT) Thursday, March 24, shortly after depleting fuel and ceasing operations. During a 12-year period, the venerable spacecraft collected and returned comet material to Earth and was reused after the end of its prime mission in 2006 to observe and study another comet during February 2011.
The Stardust team performed the burn to depletion because the comet hunter was literally running on fumes. The depletion maneuver command was sent from the Stardust-NExT mission control area at Lockheed Martin Space Systems in Denver. The operation was designed to fire Stardust's rockets until no fuel remained in the tank or fuel lines. The spacecraft sent acknowledgment of its last command from approximately 312 million kilometers (194 million miles) away in space.
"This is the end of the spacecraft's operations, but really just the beginnings of what this spacecraft's accomplishments will give to planetary science," said Lindley Johnson, Stardust-NExT and Discovery program executive at NASA Headquarters in Washington. "The treasure-trove of science data and engineering information collected and returned by Stardust is invaluable for planning future deep space planetary missions."
After completion of the burn, mission personnel began comparing the computed amount of fuel consumed during the engine firing with the anticipated amount based on consumption models. The models are required to track fuel levels, because there are no fully reliable fuel gauges for spacecraft in the weightless environment of space. Mission planners use approximate fuel usage by reviewing the history of the vehicle's flight, how many times and how long its rocket motors fired.
"Stardust's motors burned for 146 seconds," said Allan Cheuvront, Lockheed Martin Space Systems Company program manager for Stardust-NExT in Denver. "We'll crunch the numbers and see how close the reality matches up with our projections. That will be a great data set to have in our back pocket when we plan for future missions."
Launched Feb. 7, 1999, Stardust flew past the asteroid named Annefrank and traveled halfway to Jupiter to collect the particle samples from the comet Wild 2. The spacecraft returned to Earth's vicinity to drop off a sample return capsule eagerly awaited by comet scientists.
NASA re-tasked the spacecraft as Stardust-NExT to perform a bonus mission and fly past comet Tempel 1, which was struck by the Deep Impact mission in 2005. The mission collected images and other scientific data to compare with images of that comet collected by the Deep Impact mission in 2005. Stardust traveled approximately 21 million kilometers (13 million miles) around the sun in the weeks after the successful Tempel 1 flyby. The Stardust-NExT mission met all mission goals, and the spacecraft was extremely successful during both missions. From launch until final rocket engine burn, Stardust travelled approximately 5.69 billion kilometers (3.54 billion miles).
After the mileage logged in space, the Stardust team knew the end was near for the spacecraft. With its fuel tank empty and final radio transmission concluded, history's most traveled comet hunter will move from NASA's active mission roster to retired.
"This kind of feels like the end of one of those old western movies where you watch the hero ride his horse towards the distant setting sun -- and then the credits begin to roll," said Stardust-NExT project manager Tim Larson from NASA's Jet Propulsion Laboratory in Pasadena, Calif. "Only there's no setting sun in space."
Stardust and Stardust-NExT missions were managed by JPL for NASA's Science Mission Directorate in Washington. The missions were part of the Discovery Program managed at NASA's Marshall Space Flight Center in Huntsville, Ala. Joe Veverka of Cornell University was the Stardust-NExT principal investigator. Don Brownlee of the University of Washington in Seattle was the Stardust principal investigator. Lockheed Martin Space Systems built the spacecraft and managed day-to-day mission operations.
For more information visit http://www.nasa.gov/mission_pages/stardust/news/stardust20110325.html
useful links: Ferrini Boots, boy suits, Alligator boots
8:48 PM
Gabriella Brianna
, Posted in
NASA News
,
0 Comments
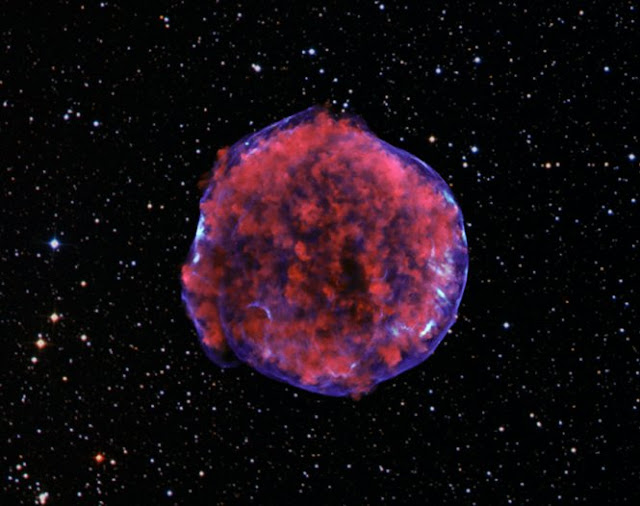
The discovery of a pattern of X-ray “stripes” in the remains of an exploded star may provide the first direct evidence that a cosmic event can accelerate particles to energies a hundred times higher than achieved by the most powerful particle accelerator on Earth.
This result comes from a very long observation of the Tycho supernova remnant with NASA's Chandra X-ray Observatory. It could explain how some of the extremely energetic particles bombarding the Earth, called cosmic rays, are produced.
“We've seen lots of intriguing structures in supernova remnants, but we’ve never seen stripes before,” said Kristoffer Eriksen of Rutgers University, who led the study. “This made us think very hard about what's happening in the blast wave of this powerful explosion.” This latest study from Chandra provides support for a theory about how magnetic fields can be dramatically amplified in such blast waves.
In this theory, the magnetic fields become highly tangled and the motions of the particles very turbulent near the expanding supernova shock wave at the front edge of the supernova remnant. High-energy charged particles can bounce back and forth across the shock wave repeatedly, gaining energy with each crossing. Theoretical models of the motion of the most energetic particles -- which are mostly protons -- are predicted to leave a messy network of holes and dense walls corresponding to weak and strong regions of magnetic fields, respectively.
The X-ray stripes discovered by the Chandra researchers are thought to be regions where the turbulence is greater and the magnetic fields more tangled than surrounding areas, and may be the walls predicted by the theory. Electrons become trapped in these regions and emit X-rays as they spiral around the magnetic field lines.
However, the regular and almost periodic pattern of the X-ray stripes was not predicted by the theory.
"It was a big surprise to find such a neatly arranged set of stripes," said co-author Jack Hughes, also of Rutgers. "We were not expecting so much order to appear in so much chaos. It could mean that the theory is incomplete, or that there's something else we don't understand."
Assuming that the spacing between the X-ray stripes corresponds to the radius of the spiraling motion of the highest energy protons in the supernova remnant, the spacing corresponds to energies about 100 times higher than reached in the Large Hadron Collider. These energies equal the highest energies of cosmic rays thought to be produced in our Galaxy.
Because cosmic rays are composed of charged particles, like protons and electrons, their direction of motion changes when they encounter magnetic fields throughout the galaxy. So, the origin of individual cosmic rays detected on Earth cannot be determined.
Supernova remnants have long been considered a good candidate for producing the most energetic cosmic rays in our Galaxy. The protons can reach energies that are hundreds of times higher than the highest energy electrons, but since they do not radiate efficiently like the electrons, direct evidence for the acceleration of cosmic ray protons in supernova remnants has been lacking.
These results also support the prediction that magnetic fields in interstellar space are greatly amplified in supernova remnants, but the difference between the observed and predicted structures means that other interpretations cannot be ruled out.
"We were excited to discover these stripes because they might allow us to directly track, for the first time, the origin of the most energetic particles produced in our galaxy," said Eriksen. "But, we're not claiming victory yet."
The Tycho supernova remnant is named for the famous Danish astronomer Tycho Brahe, who reported observing the supernova in 1572. Scientists think the explosion occurred when a white dwarf star grew in mass and exceeded its weight limit, forming a so-called Type Ia supernova. The Tycho remnant is located in the Milky Way, about 13,000 light years from Earth.
"Supernova remnants are our best cosmic laboratories for understanding how nature accelerates the highest energy cosmic rays," said Roger Blandford of Stanford University, a noted expert in this field who was not involved with these findings. "These careful measurements provide a very strong clue as to what actually happens at these giant shock fronts."
These results were published in the February 20th, 2011 issue of The Astrophysical Journal Letters. The other co-authors are Carles Badenes from Tel-Aviv University and the Weizmann Institute of Science in Israel, Robert Fesen from Dartmouth College, NH, Parviz Ghavamian from Space Telescope Science Institute, Baltimore, MD, David Moffett, from Furman University, Greenville, SC, Paul Plucinsky from Harvard-Smithsonian Center for Astrophysics (CfA), Cambridge, MA, Cara Rakowski from the Naval Research Laboratory, Washington, DC, Estela M. Reynoso from the Institute of Astronomy and Space Physics and University of Buenos Aires, Argentina and Patrick Slane from CfA.
NASA's Marshall Space Flight Center in Huntsville, Ala., manages the Chandra program for NASA's Science Mission Directorate in Washington. The Smithsonian Astrophysical Observatory controls Chandra's science and flight operations from Cambridge, Mass.
For more information visit http://www.nasa.gov/mission_pages/chandra/news/tycho.html
useful links: Ferrini Boots, boy suits, Alligator boots
8:48 PM
Gabriella Brianna
, Posted in
NASA News
,
0 Comments
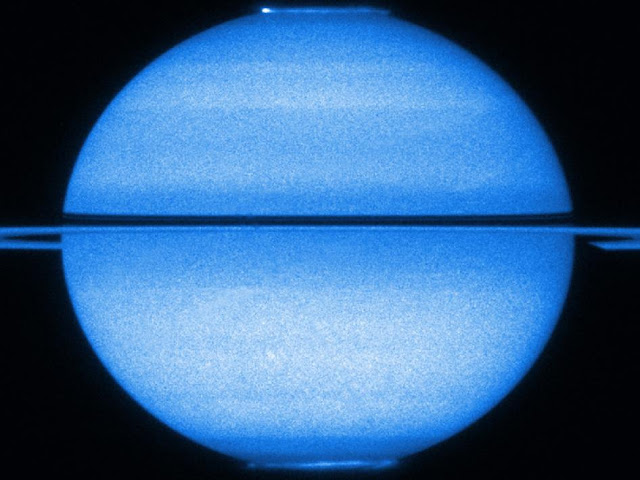
Like a petulant adolescent, Saturn is sending out mixed signals.
Recent data from NASA's Cassini spacecraft show that the variation in radio waves controlled by the planet's rotation is different in the northern and southern hemispheres. Moreover, the northern and southern rotational variations also appear to change with the Saturnian seasons, and the hemispheres have actually swapped rates. These two radio waves, converted to the human audio range, can be heard in a new video available online at: http://www.nasa.gov/multimedia/videogallery/index.html?media_id=74390781
"These data just go to show how weird Saturn is," said Don Gurnett, Cassini's radio and plasma wave science instrument team lead and professor of physics at the University of Iowa, Iowa City. "We thought we understood these radio wave patterns at gas giants, since Jupiter was so straightforward. Without Cassini's long stay, scientists wouldn't have understood that the radio emissions from Saturn are so different."
Saturn emits radio waves known as Saturn Kilometric Radiation, or SKR for short. To Cassini, they sound a bit like bursts of a spinning air raid siren, since the radio waves vary with each rotation of the planet. This kind of radio wave pattern had been previously used at Jupiter to measure the planet's rotation rate, but at Saturn, as is the case with teenagers, the situation turned out to be much more complicated.
When NASA's Voyager spacecraft visited Saturn in the early 1980s, the radiation emissions indicated the length of Saturn's day was about 10.66 hours. But as its clocking continued by a flyby of the joint ESA-NASA Ulysses spacecraft and Cassini, the radio burst varied by seconds to minutes. A paper in Geophysical Research Letters in 2009 analyzing Cassini data showed that the Saturn Kilometric Radiation was not even a solo, but a duet, with two singers out of sync. Radio waves emanating from near the north pole had a period of around 10.6 hours; radio waves near the south pole had a period of around 10.8 hours.
A new paper led by Gurnett that was published in Geophysical Research Letters in December 2010 shows that, in recent Cassini data, the southern and northern SKR periods crossed over around March 2010, about seven months after equinox, when the sun shines directly over a planet's equator. The southern SKR period decreased from about 10.8 hours on Jan. 1, 2008 and crossed with the northern SKR period around March 1, 2010, at around 10.67 hours. The northern period increased from about 10.58 hours to that convergence point.
Seeing this kind of crossover led the Cassini scientists to go back into data from previous Saturnian visits. With a new eye, they saw that NASA's Voyager data taken in 1980, about a year after Saturn's 1979 equinox, showed different warbles from Saturn's northern and southern poles. They also saw a similar kind of effect in the Ulysses radio data between 1993 and 2000. The northern and southern periods detected by Ulysses converged and crossed over around August 1996, about nine months after the previous Saturnian equinox.
Cassini scientists don't think the differences in the radio wave periods had to do with hemispheres actually rotating at different rates, but more likely came from variations in high-altitude winds in the northern and southern hemispheres. Two other papers involving Cassini investigators were published in December, with results complementary to the radio and plasma wave science instrument -- one by Jon Nichols, University of Leicester, U.K., in the same issue of Geophysical Research Letters, and the other led by David Andrews, also of University of Leicester, in the Journal of Geophysical Research.
In the Nichols paper, data from the NASA/ESA Hubble Space Telescope showed the northern and southern auroras on Saturn wobbled back and forth in latitude in a pattern matching the radio wave variations, from January to March 2009, just before equinox. The radio signal and aurora data are complementary because they are both related to the behavior of the magnetic bubble around Saturn, known as the magnetosphere. The paper by Andrews, a Cassini magnetometer team associate, showed that from mid-2004 to mid-2009, Saturn's magnetic field over the two poles wobbled at the same separate periods as the radio waves and the aurora.
"The rain of electrons into the atmosphere that produces the auroras also produces the radio emissions and affects the magnetic field, so scientists think that all these variations we see are related to the sun's changing influence on the planet," said Stanley Cowley, a co-author on both papers, co-investigator on Cassini's magnetometer instrument, and professor at the University of Leicester.
As the sun continues to climb towards the north pole of Saturn, Gurnett's group has continued to see the crossover trend in radio signals through Jan. 1, 2011. The period of the southern radio signals continued to decrease to about 10.54 hours, while the period of the northern radio signals increased to 10.71 hours.
"These papers are important in helping to explain the complicated dance between the sun and Saturn's magnetic bubble, something normally invisible to the human eye and imperceptible to the human ear," said Marcia Burton, a Cassini fields and particles scientist at NASA's Jet Propulsion Laboratory, Pasadena, Calif., who was not involved in the work. "Cassini will continue to keep an eye on these changes."
The Cassini-Huygens mission is a cooperative project of NASA, the European Space Agency and the Italian Space Agency. JPL, a division of the California Institute of Technology in Pasadena, manages the mission for NASA's Science Mission Directorate, Washington, D.C. The Cassini orbiter and its two onboard cameras were designed, developed and assembled at JPL. The radio and plasma wave science team is based at the University of Iowa, Iowa City, where the instrument was built. The magnetometer team is based at Imperial College, London, U.K.
The Hubble Space Telescope is a project of international cooperation between NASA and the European Space Agency. NASA's Goddard Space Flight Center manages the telescope. The Space Telescope Science Institute conducts Hubble science operations. STScI is operated for NASA by the Association of Universities for Research in Astronomy, Inc., in Washington, D.C.
For More information visit http://www.nasa.gov/mission_pages/cassini/whycassini/cassini20110322.html
useful links: Ferrini Boots, boy suits, Alligator boots
8:47 PM
Gabriella Brianna
, Posted in
NASA News
,
0 Comments

After a hibernation of about six months, the framing cameras on board NASA's Dawn spacecraft have again ventured a look into the stars. The spacecraft also powered up its visible and infrared mapping spectrometer, which investigates surface mineralogy, and the gamma ray and neutron detector, which detects elemental composition. The reactivation prepares the instruments for the May approach and July arrival at Vesta, Dawn's first port of call in the asteroid belt.
"Last week, we gently 'woke up' Dawn's three science instruments, which typically spend most of their time sleeping during the three-and-a-half-year journey to Vesta," said Robert Mase, Dawn project manager at NASA's Jet Propulsion Laboratory, Pasadena, Calif. "This activity confirms that Dawn is on track for the first close examination of one of the last unexplored worlds of the inner solar system."
The framing camera activities were led by scientists from the Max Planck Institute for Solar System Research in Katlenburg-Lindau, Germany. "The camera system is working flawlessly. The dry run was a complete success," said Andreas Nathues, lead investigator for the framing camera, based at the Institute.
The international team of Dawn scientists and engineers in Germany and the United States spent three days interacting with the camera system, confirming the excellent health of the mechanical and electrical components and updating the software.
In the months to come, the camera system will provide images needed to navigate the spacecraft to its rendezvous with Vesta, and will begin to image the asteroid's surface. These early images on approach will be the start of a campaign to systematically map Vesta's surface in detail and will provide tantalizing clues as to its mineralogical composition. In addition, the framing cameras will search for moons in Vesta's vicinity and look for evidence of past volcanic activity.
The full release on the framing camera from Max Planck is available at: http://www.mps.mpg.de/en/aktuelles/pressenotizen/pressenotiz_20110321.html .
The Dawn mission to Vesta and Ceres is managed by the Jet Propulsion Laboratory, a division of the California Institute of Technology in Pasadena, for NASA's Science Mission Directorate, Washington. The Dawn mission is part of the Discovery Program managed by NASA's Marshall Space Flight Center in Huntsville, Ala. UCLA is responsible for overall Dawn mission science. The framing cameras have been developed and built under the leadership of the Max Planck Institute for Solar System Research, Katlenburg-Lindau, Germany, with significant contributions by DLR German Aerospace Center, Institute of Planetary Research, Berlin, and in coordination with the Institute of Computer and Communication Network Engineering, Braunschweig. The framing camera project is funded by the Max Planck Society, DLR, and NASA. The visible and infrared mapping spectrometer was provided by the Italian Space Agency and is operated by Italy's National Institute for Astrophysics in collaboration with Galileo Avionica, where it was built. The gamma ray and neutron detector was built by Los Alamos National Laboratory and is operated by the Planetary Science Institute, Tucson, Ariz.
For more information visit http://www.jpl.nasa.gov/news/news.cfm?release=2011-089
useful links: Ferrini Boots, boy suits, Alligator boots
9:35 PM
Gabriella Brianna
, Posted in
NASA News
,
0 Comments
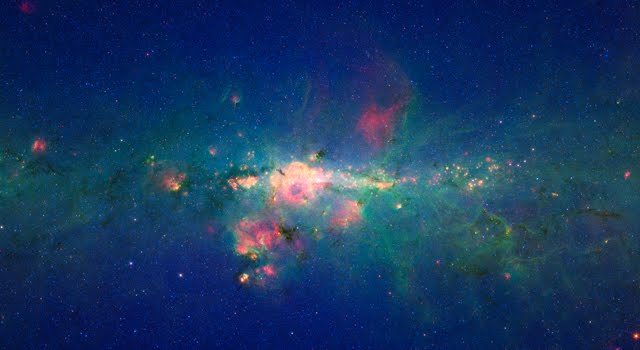
The region around the center of our Milky Way galaxy glows colorfully in this new version of an image taken by NASA's Spitzer Space Telescope.
The data were previously released as part of a long, 120-degree view of the plane our galaxy (see http://www.spitzer.caltech.edu/images/2680-ssc2008-11a-Spitzer-Finds-Clarity-in-the-Inner-Milky-Way). Now, data from the very center of that picture are being presented at a different contrast to better highlight this jam-packed region. In visible-light pictures, it is all but impossible to see the heart of our galaxy, but infrared light penetrates the shroud of dust giving us this unprecedented view.
In this Spitzer image, the myriad of stars crowding the center of our galaxy creates the blue haze that brightens towards the center of the image. The green features are from carbon-rich dust molecules, called polycyclic aromatic hydrocarbons, which are illuminated by the surrounding starlight as they swirl around the galaxy's core. The yellow-red patches are the thermal glow from warm dust. The polycyclic aromatic hydrocarbons and dust are associated with bustling hubs of young stars. These materials, mixed with gas, are required for making new stars.
The brightest white feature at the center of the image is the central star cluster in our galaxy. At a distance of 26,000 light years away from Earth, it is so distant that, to Spitzer's view, most of the light from the thousands of individual stars is blurred into a single glowing blotch. Astronomers have determined that these stars are orbiting a massive black hole that lies at the very center of the galaxy.
The region pictured here is immense, with a horizontal span of 2,400 light-years (5.3 degrees) and a vertical span of 1,360 light-years (3 degrees). Though most of the objects seen in this image are located near the galactic center, the features above and below the galactic plane tend to lie closer to Earth.
The image is a three-color composite, showing infrared observations from two of Spitzer instruments. Blue represents 3.6-micron light and green shows 8-micron light, both captured by Spitzer's infrared array camera. Red is 24-micron light detected by Spitzer's multiband imaging photometer. The data is a combination of observations from the Galactic Legacy Infrared Mid-Plane Survey Extraordinaire (GLIMPSE) project, and the Multiband Imaging Photometer for Spitzer Galactic survey (MIPSGAL).
For more information visit http://www.jpl.nasa.gov/news/news.cfm?release=2011-088
useful links: Ferrini Boots, boy suits, Alligator boots
8:47 PM
Gabriella Brianna
, Posted in
NASA News
,
0 Comments
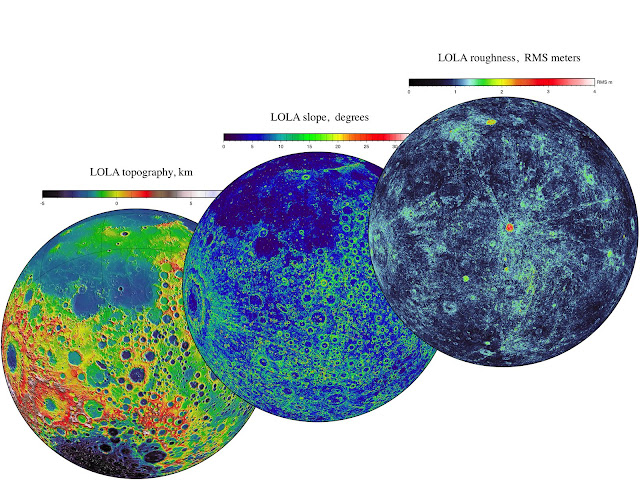
NASA's Lunar Reconnaissance Orbiter (LRO) team released Tuesday the final set of data from the mission's exploration phase along with the first measurements from its new life as a science satellite.
With this fifth release of data, striking new images and maps have been added to the already comprehensive collection of raw lunar data and high-level products, including mosaic images, that LRO has made possible. The spacecraft's seven instruments delivered more than 192 terabytes of data with an unprecedented level of detail. It would take approximately 41,000 typical DVDs to hold the new LRO data set.
"The release of such a comprehensive and rich collection of data, maps and images reinforces the tremendous success we have had with LRO in the Exploration Systems Mission Directorate and with lunar science," said Michael Wargo, chief lunar scientist of the Exploration Systems Mission Directorate at NASA Headquarters in Washington.
Among the latest products is a global map with a resolution of 100 meters per pixel from the Lunar Reconnaissance Orbiter Camera (LROC). To enhance the topography of the moon, this map was made from images collected when the sun angle was low on the horizon. Armchair astronauts can zoom in to full resolution with any of the mosaics—quite a feat considering that each is 34,748 pixels by 34,748 pixels, or approximately 1.1 gigabytes.
"Because the moon is so close and because we have a dedicated ground station, we are able to bring back as much data from LRO as from all the other planetary missions combined," said LRO Project Scientist Richard Vondrak of NASA's Goddard Space Flight Center in Greenbelt, Md.
LRO's Diviner Lunar Radiometer Experiment is providing new data relating to the moon's surface. These include maps of visual and infrared brightness, temperature, rock abundance, nighttime soil temperature and surface mineralogy. The data are in the form of more than 1700 digital maps at a range of resolutions that can be overlaid easily on other lunar data sets.
The Lyman-Alpha Mapping Project, which collects information to help identify surface water-ice deposits, especially in permanently-shadowed regions of the moon, also has new data. This release includes new maps of far-ultraviolet (FUV) brightness, albedo and water-ice data as well as instrument exposure, illumination and other conditions.
As a complement to the high-resolution digital elevation maps, representing 3.4 billion measurements already released by the Lunar Orbiter Laser Altimeter team, the group is delivering new maps of slope, roughness and illumination conditions. New maps from the Lunar Exploration Neutron Detector, and the latest data from the Cosmic Ray Telescope for the Effects of Radiation and the Miniature Radio Frequency instruments, also are featured.
"All these global maps and other data are available at a very high resolution -- that's what makes this release exciting," said Goddard's John Keller, the LRO deputy project scientist. "With this valuable collection, researchers worldwide are getting the best view of the moon they have ever had."
The complete data set contains the raw information and high-level products such as mosaic images and maps. The data set also includes more than 300,000 calibrated data records released by LROC. All of the final records from the exploration phase, which lasted from Sept. 15, 2009 through Sept. 15, 2010, are available through several of the Planetary Data System nodes and the LROC website.
For more information visit http://www.nasa.gov/mission_pages/LRO/news/terabytes.html
useful links: Ferrini Boots, boy suits, Alligator boots
9:13 PM
Gabriella Brianna
, Posted in
NASA News
,
0 Comments
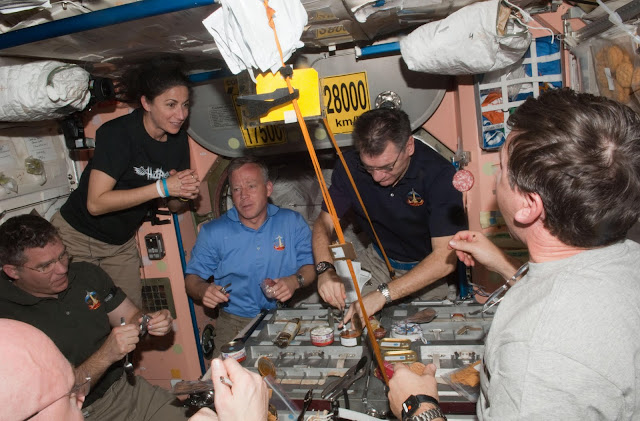
The crew of STS-133 closed out space shuttle Discovery's roster of accomplishments with a virtually flawless 13-day flight to attach a new module to the International Space Station and help the residents there outfit the orbiting laboratory for continued research.
Commander Steve Lindsey, Pilot Eric Boe and Mission Specialists Alvin Drew, Michael Barratt, Nicole Stott and Steve Bowen lifted off aboard Discovery on Feb. 24, 2011, from NASA's Kennedy Space Center in Florida to begin the spacecraft's pursuit of the station.
With Lindsey at the controls, Discovery rendezvoused with the station two days later and then backed the shuttle to its berthing port. Discovery's docking completed the rare occasion of having vehicles from the United States, Russia, Europe and Japan connected to the International Space Station at the same time. Along with the shuttle and the Russian Soyuz capsules, the European Space Agency's uncrewed Automated Transferred Vehicle-2 and the Japan Aerospace Exploration Agency's H-II Transfer Vehicle, or HTV, were attached to the station.
Discovery's six astronauts joined the six residents on the station for a quick welcome before they teamed up to move an equipment platform out of the shuttle's cargo bay and onto the station's truss.
The Express Logistics Carrier had been loaded on Earth with spare parts for the station, including a radiator to cool the station's systems. The parts will not be installed until they are needed as replacements.
Barratt and Stott operated the space station's robotic arm to lift the platform out of Discovery's cargo bay. They handed it off to the shuttle's own robotic arm, worked by Boe and Drew. After the station arm was maneuvered to a new location, the shuttle arm was used to hand it back to the station arm, which maneuvered the platform to its final location on the station's backbone.
Drew and Bowen left the station's Quest airlock Feb. 28 on the first of two spacewalks planned for the mission. Working inside Discovery's cargo bay and on the station, the duo put the finishing touches on the outside of the Permanent Multipurpose Module, or PMM, so it could be installed on the station and they moved a failed pump module to a stowage platform where it will stay until it can be brought back to Earth for evaluation.
Station Commander Scott Kelly worked with Barratt to drive the station's robotic arm during the spacewalk to assist Bowen and Drew. Although a glitch in the arm's control system prompted them to move to a backup location, the spacewalk's objectives were completed.
Barratt and Stott took the controls of the station's robotic arm again the next day to attach the new module to the underside of the station, connecting it to the Earth-facing side of the Unity node. The PMM is a closet for the space station, giving the crew more room to store equipment and supplies. Technicians retrofitted the Italian-built Leonardo resupply module with meteorite shielding and other gear so it could be permanently attached to the station.
The module went into space loaded with equipment, experiments and supplies for the station, so the shuttle and station crews worked throughout the mission to unpack some of the material in the PMM as well as the supplies inside the European and Japanese cargo ships.
Bowen and Drew ventured outside the station again on the mission's seventh day in space. Bowen, riding the station's robotic arm, disconnected an experiment rack from the outside of the Columbus laboratory module and Drew removed covers from the logistics carrier Discovery brought up.
The crews of both spacecraft spent the next week working inside the space station to prepare it for continuing research operations. Outfitting work inside the PMM included removing launch supports and putting unneeded materials into the HTV, which will be jettisoned later to burn up in the atmosphere.
Discovery left the space station Monday, March 7 and its crew began prepping the shuttle for its final glide back to Earth.
The shuttle soared through mostly clear skies over Florida on Wednesday, March 9. Lindsey guided Discovery onto Kennedy's runway at 11:57 a.m. EST.
After the landing, reflection mixed with celebration after Discovery completed the last of its 39 missions into orbit. Lindsey and his crew walked beneath the shuttle with NASA officials including Administrator Charles Bolden.
"I am so glad we got to land here at Kennedy, the home of Discovery," STS-133 Commander Steve Lindsey said. "As the minutes pass, I'm actually getting sadder and sadder about this being the last flight and I know all the folks involved with the shuttle program feel the same way."
Bill Gerstenmaier, NASA's associate administrator of Space Operations, said the work was critical to set up the station and its crew for research.
"I think (Discovery's) legacy will be the future," Gerstenmaier said.
Although Discovery will not go back into space, it still will offer scientific insight to future engineers, said Mike Moses, chairman of the Mission Management Team.
"The vehicle itself is a science platform," he said, adding that parts of Discovery will be pulled from the spacecraft and evaluated for wear.
The shuttle teams throughout NASA drew special praise for the longevity of the program and its successes, along with the workers' diligence.
"Discovery was in great shape and I view that as a testament to the team," Moses said. "It was really a triumph today for the entire Discovery team."
"We wanted to go out on a high note and Discovery's done that," said Mike Leinbach, shuttle launch director. "We couldn't ask for more."
For more information visit http://www.nasa.gov/mission_pages/shuttle/shuttlemissions/sts133/launch/sts133overview.html
useful links: Ferrini Boots, boy suits, Alligator boots
8:47 PM
Gabriella Brianna
, Posted in
NASA News
,
0 Comments
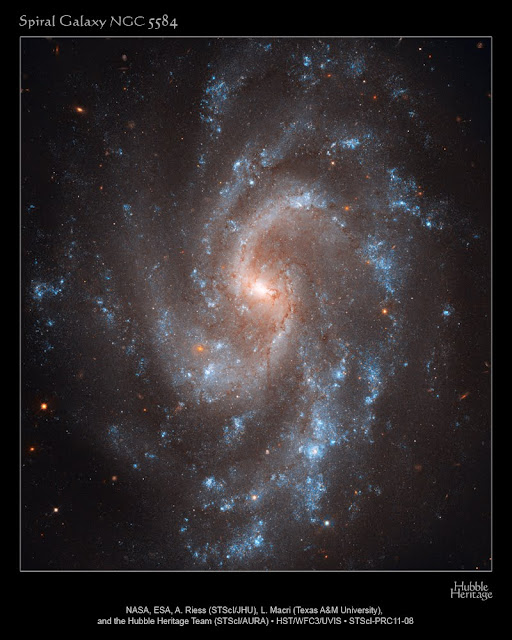
Astronomers using NASA's Hubble Space Telescope have ruled out an alternate theory on the nature of dark energy after recalculating the expansion rate of the universe to unprecedented accuracy.
The universe appears to be expanding at an increasing rate. Some believe that is because the universe is filled with a dark energy that works in the opposite way of gravity. One alternative to that hypothesis is that an enormous bubble of relatively empty space eight billion light-years across surrounds our galactic neighborhood. If we lived near the center of this void, observations of galaxies being pushed away from each other at accelerating speeds would be an illusion.
This hypothesis has been invalidated because astronomers have refined their understanding of the universe's present expansion rate. Adam Riess of the Space Telescope Science Institute (STScI) and Johns Hopkins University in Baltimore, Md., led the research. The Hubble observations were conducted by the SHOES (Supernova Ho for the Equation of State) team that works to refine the accuracy of the Hubble constant to a precision that allows for a better characterization of dark energy's behavior. The observations helped determine a figure for the universe's current expansion rate to an uncertainty of just 3.3 percent. The new measurement reduces the error margin by 30 percent over Hubble's previous best measurement of 2009. Riess' results appear in the April 1 issue of The Astrophysical Journal.
The value for the expansion rate is 73.8 kilometers per second per megaparsec. It means that for every additional million parsecs (3.26 million light-years) a galaxy is from Earth, the galaxy appears to be traveling 73.8 kilometers per second faster away from us.
Every decrease in uncertainty of the universe’s expansion rate helps solidify our understanding of its cosmic ingredients. Knowing the precise value of the universe's expansion rate further restricts the range of dark energy's strength and helps astronomers tighten up their estimates of other cosmic properties, including the universe's shape and its roster of neutrinos, or ghostly particles, that filled the early universe.
"We are using the new camera on Hubble like a policeman’s radar gun to catch the universe speeding," Riess said. "It looks more like it's dark energy that’s pressing on the gas pedal."
Bursting the Bubble
Dark energy is one of the greatest cosmological mysteries in modern physics. Even Albert Einstein conceived of a repulsive force, called the cosmological constant, which would counter gravity and keep the universe stable. He abandoned the idea when astronomer Edwin Hubble discovered in 1929 that the universe is expanding. Observational evidence for dark energy didn’t come along until 1998, when two teams of researchers (one led by Riess) discovered it.
The idea of dark energy was so far-fetched, many scientists began contemplating other strange interpretations, including the cosmic bubble theory. In this theory, the lower-density bubble would expand faster than the more massive universe around it. To an observer inside the bubble, it would appear that a dark-energy-like force was pushing the entire universe apart. The bubble hypothesis requires that the universe’s expansion rate be much slower than astronomers have calculated, about 60 to 65 kilometers per second per megaparsec. By reducing the uncertainty of the Hubble constant’s value to 3.3 percent, Riess reports that his team has eliminated beyond all reasonable doubt the possibility of that lower number.
“The hardest part of the bubble theory to accept was that it required us to live very near the center of such an empty region of space,” explained Lucas Macri, of Texas A&M University in College Station, a key collaborator of Riess. “This has about a one in a million chance of occurring. But since we know that something weird is making the universe accelerate, it’s better to let the data be our guide.”
Using stars as “cosmic yardsticks” measuring the universe’s expansion rate is a tricky business. Riess’ team first had to determine accurate distances to galaxies near and far from Earth. The team compared those distances with the speed at which the galaxies are apparently receding because of the expansion of space. They used those two values to calculate the Hubble constant, the number that relates the speed at which a galaxy appears to recede to its distance from the Milky Way. Because astronomers cannot physically measure the distances to galaxies, researchers had to find stars or other objects that serve as reliable cosmic yardsticks. These are objects with an intrinsic brightness, brightness that hasn't been dimmed by distance, an atmosphere, or stellar dust, that is known. Their distances, therefore, can be inferred by comparing their true brightness with their apparent brightness as seen from Earth.
Among the most reliable of these cosmic yardsticks for relatively shorter distances are Cepheid variables, pulsating stars that dim and fade at rates that correspond to their intrinsic luminosity. But Cepheids are too dim to be found in very distant galaxies. To calculate longer distances, Riess’ team chose a special class of exploding stars called Type Ia supernovae. These stellar explosions all flare with similar luminosity and are brilliant enough to be seen far across the universe. By comparing the apparent brightness of Type la supernovae and pulsating Cepheid stars, the astronomers could measure accurately their intrinsic brightness and therefore calculate distances to Type Ia supernovae in far-flung galaxies.
Using the sharpness of the new Wide Field Camera 3 (WFC3) to study more stars in visible and near-infrared light, scientists eliminated systematic errors introduced by comparing measurements from different telescopes.
"WFC3 is the best camera ever flown on Hubble for making these measurements, improving the precision of prior measurements in a small fraction of the time it previously took," said Macri.
Using one instrument to measure the Hubble constant is like measuring a hallway with a tape measure instead of by laying a ruler from end to end. By avoiding the need to pick up the ruler and lay it back down, you can prevent mistakes. “The camera on Hubble, WFC3, is the best ever flown on Hubble for making these measurements, improving the precision of prior measurements in a small fraction of the time it previously took,” Riess said.
The astronomer hopes that Hubble will continue to be used in this way to reduce the uncertainty in the Hubble constant even more, and thus refine the measured properties of dark energy. He suggests the present uncertainty could be cut in two before Hubble gives way to improvements out of Hubble’s reach but within the scope of the James Webb Space Telescope, an infrared observatory scheduled to launch later this decade.
Chasing a runaway universe, Riess has been pursing dark energy for 13 years. He co-discovered the existence of dark energy by finding that distant Type Ia supernovae were dimmer than expected, which meant they were farther away than anticipated. The only way for that to happen, Riess realized, was if the expansion of the universe had sped up some time in the past.
Until that discovery, astronomers had generally believed that the cosmic expansion was gradually slowing down, due to the gravitational tugs that individual galaxies exert on one another. But the results implied that some mysterious force was acting against the pull of gravity, shoving galaxies away from each other at ever-increasing speeds.
Riess decided that one of the best ways to tighten the constraints on dark energy is to determine an accurate value for the Hubble constant, which he has been doing with the Hubble Space Telescope. That measurement, combined with others from NASA’s Wilkinson Microwave Anisotropy Probe (WMAP), traces the universe’s behavior from nearly the dawn of time to the present age. (WMAP showed the universe as it appeared shortly after the Big Bang, before stars and galaxies formed.)
Riess is just one of many astronomers who, over the past 80 years, have been measuring and re-measuring the Hubble constant. The Hubble telescope has played a major role in helping astronomers precisely measure the universe, expansion. Before Hubble was launched in 1990, the estimates for the Hubble constant varied by a factor of two. In 1999, the Hubble Space Telescope Key Project on the Extragalactic Distance Scale refined the value of the Hubble constant to an error of about 10 percent.
For more information visit http://www.nasa.gov/mission_pages/hubble/science/cosmic-expansion.html
useful links: Ferrini Boots, boy suits, Alligator boots
8:45 PM
Gabriella Brianna
, Posted in
NASA News
,
0 Comments
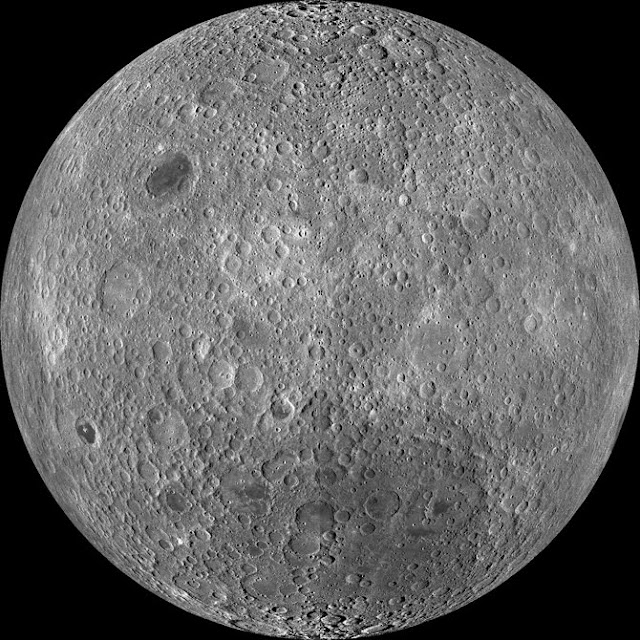
Because the moon is tidally locked (meaning the same side always faces Earth), it was not until 1959 that the farside was first imaged by the Soviet Luna 3 spacecraft (hence the Russian names for prominent farside features, such as Mare Moscoviense). And what a surprise - unlike the widespread maria on the nearside, basaltic volcanism was restricted to a relatively few, smaller regions on the farside, and the battered highlands crust dominated. A different world from what we saw from Earth.
Of course, the cause of the farside/nearside asymmetry is an interesting scientific question. Past studies have shown that the crust on the farside is thicker, likely making it more difficult for magmas to erupt on the surface, limiting the amount of farside mare basalts. Why is the farside crust thicker? That is still up for debate, and in fact several presentations at this week's Lunar and Planetary Science Conference attempt to answer this question.
The Clementine mission obtained beautiful mosaics with the sun high in the sky (low phase angles), but did not have the opportunity to observe the farside at sun angles favorable for seeing surface topography. This WAC mosaic provides the most complete look at the morphology of the farside to date, and will provide a valuable resource for the scientific community. And it's simply a spectacular sight!
The Lunar Reconnaissance Orbiter Camera (LROC) Wide Angle Camera (WAC) is a push-frame camera that captures seven color bands (321, 360, 415, 566, 604, 643, and 689 nm) with a 57-km swath (105-km swath in monochrome mode) from a 50 km orbit. One of the primary objectives of LROC is to provide a global 100 m/pixel monochrome (643 nm) base map with incidence angles between 55°-70° at the equator, lighting that is favorable for morphological interpretations. Each month, the WAC provides nearly complete coverage of the Moon under unique lighting. As an added bonus, the orbit-to-orbit image overlap provides stereo coverage. Reducing all these stereo images into a global topographic map is a big job, and is being led by LROC Team Members from the German Aerospace Center (Deutsches Zentrum für Luft- und Raumfahrt; DLR). Several preliminary WAC topographic products have appeared in LROC featured images over the past year (Orientale basin, Sinus Iridum). For a sneak preview of the WAC global DEM with the WAC global mosaic, view a rotating composite moon (70 MB video from ASU's LROC website). The WAC topographic dataset will be completed and released later this year.
The global mosaic released today is comprised of over 15,000 WAC images acquired between November 2009 and February 2011. The non-polar images were map projected onto the GLD100 shape model (WAC derived 100 m/pixel DTM), while polar images were map projected on the LOLA shape model. In addition, the LOLA derived crossover corrected ephemeris, and an improved camera pointing, provide accurate positioning (better than 100 m) of each WAC image.
As part of the March 2011 PDS release, the LROC team posted the global map in ten regional tiles. Eight of the tiles are equirectangular projections that encompass 60° latitude by 90° longitude. In addition, two polar stereographic projections are available for each pole from ±60° to the pole. These reduced data records (RDR) products will be available for download on March 15, 2011. As the mission progresses, and our knowledge of the lunar photometric function increases, improved and new mosaics will be released! Work your way around the moon with these six orthographic projections constructed from WAC mosaics. The nearside view linked below is different from that released on 21 February.
For more information visit http://www.nasa.gov/mission_pages/LRO/news/lro-farside.html
7:48 PM
Gabriella Brianna
, Posted in
NASA News
,
0 Comments
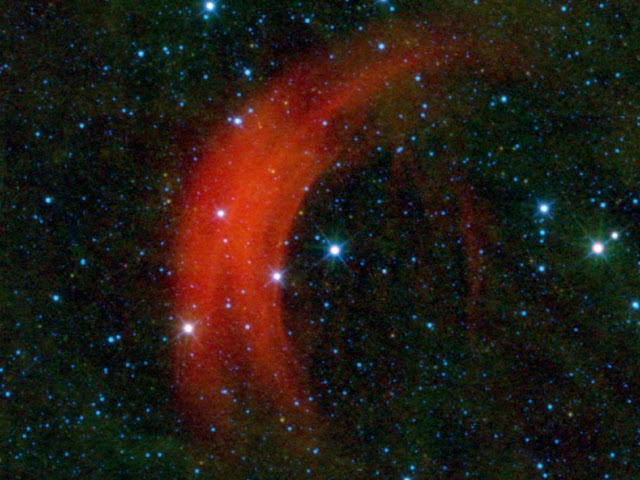
Just as some drivers obey the speed limit while others treat every road as if it were the Autobahn, some stars move through space faster than others. NASA's Wide-field Infrared Survey Explorer, or WISE, captured this image of the star Alpha Camelopardalis, or Alpha Cam, in astronomer-speak, speeding through the sky like a motorcyclist zipping through rush-hour traffic. The supergiant star Alpha Cam is the bright star in the middle of this image, surrounded on one side by an arc-shaped cloud of dust and gas -- a bow shock -- which is colored red in this infrared view.
Such fast-moving stars are called runaway stars. The distance and speed of Alpha Cam is somewhat uncertain. It is probably somewhere between 1,600 and 6,900 light-years away and moving at an astonishing rate of somewhere between 680 and 4,200 kilometers per second (between 1.5 and 9.4 million mph). It turns out that WISE is particularly adept at imaging bow shocks from runaway stars. Previous examples can be seen around Zeta Ophiuchi , AE Aurigae, and Menkhib. But Alpha Cam revs things up into a different gear. To put its speed into perspective, if Alpha Cam were a car driving across the United States at 4,200 kilometers per second, it would take less than one second to travel from San Francisco to New York City!
Astronomers believe runaway stars are set into motion either through the supernova explosion of a companion star or through gravitational interactions with other stars in a cluster. Because Alpha Cam is a supergiant star, it gives off a very strong wind. The speed of the wind is boosted in the forward direction the star is moving in space. When this fast-moving wind slams into the slower-moving interstellar material, a bow shock is created, similar to the wake in front of the bow of a ship in water. The stellar wind compresses the interstellar gas and dust, causing it to heat up and glow in infrared. Alpha Cam's bow shock cannot be seen in visible light, but WISE's infrared detectors show us the graceful arc of heated gas and dust around the star.
JPL manages and operates the Wide-field Infrared Survey Explorer for NASA's Science Mission Directorate, Washington. The principal investigator, Edward Wright, is at UCLA. The mission was competitively selected under NASA's Explorers Program managed by the Goddard Space Flight Center, Greenbelt, Md. The science instrument was built by the Space Dynamics Laboratory, Logan, Utah, and the spacecraft was built by Ball Aerospace & Technologies Corp., Boulder, Colo. Science operations and data processing take place at the Infrared Processing and Analysis Center at the California Institute of Technology in Pasadena. Caltech manages JPL for NASA.
For more information visit http://www.nasa.gov/mission_pages/WISE/news/wise20110310.html
useful links: Ferrini Boots, boy suits, Alligator boots
7:51 PM
Gabriella Brianna
, Posted in
NASA News
,
0 Comments

Rocks on Mars dug from far underground by crater-blasting impacts are providing glimpses of one possible way Mars' atmosphere has become much less dense than it used to be.
At several places where cratering has exposed material from depths of about 5 kilometers (3 miles) or more beneath the surface, observations by a mineral-mapping instrument on NASA's Mars Reconnaissance Orbiter indicate carbonate minerals.
These are not the first detections of carbonates on Mars. However, compared to earlier findings, they bear closer resemblance to what some scientists have theorized for decades about the whereabouts of Mars' "missing" carbon. If deeply buried carbonate layers are found to be widespread, they would help answer questions about the disappearance of most of ancient Mars' atmosphere, which is deduced to have been thick and mostly carbon dioxide. The carbon that goes into formation of carbonate minerals can come from atmospheric carbon dioxide.
"We're looking at a pretty lucky location in terms of exposing something that was deep beneath the surface," said planetary scientist James Wray of Cornell University, Ithaca, N.Y., who reported the latest carbonate findings today at the Lunar and Planetary Science Conference near Houston. Huygens crater, a basin 467 kilometers (290 miles) in diameter in the southern highlands of Mars, had already hoisted material from far underground, and then the rim of Huygens, containing the lifted material, was drilled into by a smaller, unnamed cratering event.
Observations in the high-resolution mode of the Compact Reconnaissance Imaging Spectrometer for Mars (CRISM) instrument on the Mars Reconnaissance Orbiter show spectral characteristics of calcium or iron carbonate at this site. Detections of clay minerals in lower-resolution mapping mode by CRISM had prompted closer examination with the spectrometer, and the carbonates are found near the clay minerals. Both types of minerals typically form in wet environments.
The occurrence of this type of carbonate in association with the largest impact features suggests that it was buried by a few kilometers (or miles) of younger rocks, possibly including volcanic flows and fragmented material ejected from other, nearby impacts.
These findings reinforce a report by other researchers five months ago identifying the same types of carbonate and clay minerals from CRISM observation of a site about 1,000 kilometers (600 miles) away. At that site, a meteor impact has exposed rocks from deep underground, inside Leighton crater. In their report of that discovery, Joseph Michalski of the Planetary Science Institute, Tucson, Ariz., and Paul Niles of NASA Johnson Space Center, Houston, proposed that the carbonates at Leighton "might be only a small part of a much more extensive ancient sedimentary record that has been buried by volcanic resurfacing and impact ejecta."
Carbonates found in rocks elsewhere on Mars, from orbit and by NASA's Spirit rover, are rich in magnesium. Those could form from reaction of volcanic deposits with moisture, Wray said. "The broader compositional range we're seeing that includes iron-rich and calcium-rich carbonates couldn't form as easily from just a little bit of water reacting with igneous rocks. Calcium carbonate is what you typically find on Earth's ocean and lake floors."
He said the carbonates at Huygens and Leighton "fit what would be expected from atmospheric carbon dioxide interacting with ancient bodies of water on Mars." Key additional evidence would be to find similar deposits in other regions of Mars. A hunting guide for that search is the CRISM low-resolution mapping, which has covered about three-fourths of the planet and revealed clay-mineral deposits at thousands of locations.
"A dramatic change in atmospheric density remains one of the most intriguing possibilities about early Mars," said Mars Reconnaissance Orbiter Project Scientist Richard Zurek, of NASA's Jet Propulsion Laboratory, Pasadena, Calif. "Increasing evidence for liquid water on the surface of ancient Mars for extended periods continues to suggest that the atmosphere used to be much thicker."
Carbon dioxide makes up nearly all of today's Martian air and likely was most of a thicker early atmosphere, too. In today's thin, cold atmosphere, liquid water quickly freezes or boils away.
What became of that carbon dioxide? NASA will launch the Mars Atmosphere and Volatile Evolution Mission (MAVEN) in 2013 to investigate processes that could have stripped the gas from the top of the atmosphere into interplanetary space. Meanwhile, CRISM and other instruments now in orbit continue to look for evidence that some of the carbon dioxide in that ancient atmosphere was removed, in the presence of liquid water, by formation of carbonate minerals now buried far beneath the present surface.
The Johns Hopkins University Applied Physics Laboratory, Laurel, Md., provided and operates CRISM, one of six instruments on the Mars Reconnaissance Orbiter. JPL, a division of the California Institute of Technology in Pasadena, manages the Mars Reconnaissance Orbiter project and the Mars Exploration Program for the NASA Science Mission Directorate, Washington.
For more information visit http://www.nasa.gov/mission_pages/MRO/news/mro20110308.html
useful links: Ferrini Boots, boy suits, Alligator boots


